Why is PJM’s DR Capacity Decreasing?
Your weekly brief on virtual power plants in the US & Canada. Weeks of June 29 & July 6, 2026 .

Three Takeaways
When PJM hit near-record demand over the July 4th heat wave, it leaned on thousands of megawatts of paid demand response to stay under the line — flexible load is now first-resort grid infrastructure, not a last-resort backstop.
New Jersey’s data center tariff bill mandates demand-response programs and curtails hyperscalers ahead of residential load, handing other states a template for making big loads fund their own flexibility.
Illinois approved ComEd’s utility-run VPP the same fortnight ComEd was calling demand response to survive record heat — reliability stress is pulling VPP programs from statute to dispatch.
News Roundup
Grid Reliability · 🟢 Bullish
PJM secures emergency DOE orders, dispatches Capacity Performance DR as heat wave threatens all-time record 📅 Published: 07/02/2026
PJM forecast a July 2 peak of 166,241 MW, above the grid’s all-time summer record of 165,563 MW set in 2006. The Department of Energy granted PJM a 202(c) order to curtail data centers and other large loads with backup generation as a last resort, plus a second order relaxing environmental permit limits on generating units. PJM’s own emergency procedures postings show it went beyond alerts: it dispatched Pre-Emergency Load Management actions calling “Capacity Performance DR” — the successor product to the old Special Case Resource (SCR) category — across nearly every zone including AEP, BGE, ComEd, Dominion, and PECO on both July 2 and July 3. Preliminary DR performance reached about 6,113 MW on July 2 alone.
Utility RFP & Procurement · 🟡 Neutral
PJM stakeholders approve data center reliability backstop procurement plan 📅 Published: 07/02/2026
PJM stakeholders approved a two-part plan letting utilities and data centers request a one-time capacity auction, capped at $555/MW-day. The board plans to file the proposal with FERC this month, targeting a September auction ahead of the Dec. 9 capacity auction for the 2029/30 delivery year. A separate “connect and manage” framework for curtailing data centers didn’t reach consensus; PJM staff instead proposed a large-load registry for state regulators.
Policy & Legislation · 🟢 Bullish
New Jersey lawmakers send data center tariff bill — with DR mandates — to governor 📅 Published: 07/01/2026
New Jersey’s legislature passed a bill requiring the BPU to set tariff standards for all data centers of at least 50 MW. The bill mandates development of demand-response and efficiency programs, requires flexibility-performance reporting, and prioritizes curtailing data centers before residential customers in emergencies. It now heads to Gov. Sherrill, whose office reportedly helped shape the final version.
Utility Programs · 🟢 Bullish
Illinois regulators approve ComEd VPP under new clean energy law 📅 Published: 07/08/2026
One week after leaning on demand response through the heat wave, ComEd got Illinois Commerce Commission approval for a battery-based “scheduled dispatch virtual power plant,” or SDVPP. It replaces a narrower proposal ComEd withdrew last November after the Clean and Reliable Grid Affordability Act passed. The law mandates 3 GW of storage by 2030 and directs utilities to build VPPs from residential and small-commercial batteries, EV chargers, and HVAC controls. Enrolled customers commit to five consecutive summer seasons and earn seasonal performance payments based on energy injected during peak events — the statutory storage target converting into dispatchable capacity in near real time.
Grid Reliability · 🟢 Bullish
ComEd declares “critical strain” on Chicago-area grid as PJM calls DR in its zone 📅 Published: 07/01/2026
ComEd sent an immediate energy-reduction alert to 78,000 customers on Chicago’s West Side and southwest suburbs as feels-like temperatures hit 104°F, asking customers to delay EV charging until after 8 p.m. and raise thermostats. That residential ask was voluntary, but PJM’s emergency procedures postings show ComEd’s zone was simultaneously subject to PJM’s dispatched Capacity Performance DR calls on July 2–3 — meaning the ComEd area’s enrolled DR fleet, not just goodwill, was doing real work during the peak.
Grid Reliability · 🟡 Neutral
NYISO issues Energy Watch, calls for conservation as New York approaches its 2013 demand record 📅 Published: 07/02/2026
NYISO forecast a July 2 peak of 32,410 MW, closing in on the state’s all-time record of 33,956 MW set in July 2013. On the afternoon of July 2 it issued an Energy Watch — the alert triggered when operating reserves are projected below 2,620 MW for more than an hour — but said the grid was operating normally with adequate resources to meet demand. Gov. Hochul asked residents to voluntarily raise thermostats and coordinated with Con Ed and NYISO on large-customer conservation. Unlike PJM, New York did not escalate to dispatching its paid SCR/EDRP demand-response fleet during the event — a reminder that the flexibility is only proven when the grid actually calls on it.
Utility Programs · 🟢 Bullish
Eversource launches targeted ConnectedSolutions+ pilots, dispatches an all-call on its base ConnectedSolutions program 📅 Published: 07/01/2026
Eversource launched substation-targeted DR pilots in Greater Boston and southeastern Massachusetts, recruiting batteries, EVs, and smart thermostats. Boston-area battery participants can earn a $400/kW performance incentive, and the pilots are live now during the regional heat dome. The parent ConnectedSolutions program wasn’t just standing by either: program manager Jenn Runyon told NBC Boston on July 1 that Eversource had issued “an all call” for that evening’s 5–8 p.m. peak, pre-cooling and cycling enrolled thermostats and batteries.
Utility RFP & Procurement · 🟡 Neutral
Massachusetts utilities ink contracts for 4.5 GWh of energy storage 📅 Published: 07/07/2026
Eversource, National Grid, and Unitil filed long-term contracts for about 1,068 MW / 4,472 MWh across three utility-scale storage projects toward the state’s 5 GW-by-2030 goal. The projects sit in the same Greater Boston and southeastern Massachusetts zones where Eversource is piloting the localized VPPs above. It is front-of-meter procurement, not a VPP program — but it maps the exact congestion pockets where distributed flexibility will compete for the same reliability value.
Product Announcements · 🟢 Bullish
Eaton named FranklinWH’s preferred smart-breaker supplier 📅 Published: 07/09/2026
Eaton and FranklinWH will integrate Eaton’s AbleEdge smart breakers directly into FranklinWH storage systems, with Eaton as the preferred load-management supplier. The breakers add circuit-level load control and VPP functionality in both retrofit and new-construction installs. Baking VPP-ready load management into the hardware stack lowers the enrollment friction aggregators currently absorb after the sale.
📊 By the Numbers
166,241 MW — PJM’s forecasted July 2 peak, above the grid’s 2006 record of 165,563 MW. The actual result was 168,154 GW.
~6,113 MW — preliminary demand response PJM says it performed on July 2.
32,410 MW — NYISO’s forecasted July 2 peak, approaching New York’s 2013 record of 33,956 MW.
$555/MW-day — cost cap on PJM’s new data center reliability backstop capacity procurement for the 2029/30 delivery year.
$400/kW — Eversource’s performance incentive for battery curtailment in its Boston ConnectedSolutions+ pilot.
4,472 MWh — utility-scale storage newly contracted by Massachusetts utilities (~1,068 MW).
3 GW — energy storage Illinois utilities must deploy by 2030 under the law enabling ComEd’s SDVPP.
🗓️ On the Radar
September 2026 — PJM’s targeted date for holding the data center backstop capacity auction.
Sept. 18, 2026 — DERVOS early-bird tickets now on sale, starting at $499.
Dec. 9, 2026 — PJM’s capacity auction for the 2029/30 delivery year, which the backstop procurement is meant to precede.
💬 My Take
In my last post I put forward a framework on how utility-run VPPs have antifragile characteristics following extreme weather events. As a reminder, a one sentence summary of an antifragile system is one that “increases in capability to thrive as a result of stressors.” Here are some concrete examples: APS has seen success with their VPP and they want to look to grow it significantly with the success as well as the underlying need for more flexible load. This is mirrored across other utilities’ VPPs like Duke and Eversource. The extreme weather helps prove and validate the value of these portfolios and creates a feedback loop for them to grow and the software to support them to become more capable. This feeds back into rate cases that can unlock more funding for these programs over time.
With the heat dome covering much of the Eastern United States over 4th of July weekend causing capacity forecasts to be close to record peaks in PJM and New York, my intuition is that wholesale market participation of VPPs should increase with increased value and increased utilization. In PJM, I see the opposite.
I see short term barriers that are specific for the commercial and residential customers preventing growth through the 2028-2029 participation year. The mechanics of Reliability Backstop Procurement (RBP) have the potential to change that. I forecast DR will start to grow by the 2029-2030 participation year. My takeaway is that VPP growth in PJM has slower feedback loops than utility-led VPPs. This is resulting in barriers to short-term growth.
VPP supply hasn’t responded to increased prices, yet
Two ways to quantitatively measure stress on PJM’s grid and the value for VPPs is the annual duration of emergency dispatches from PJM’s Emergency Load Response Program (ELRP) and increased value for VPP’s services, especially capacity. Both metrics increased since 2025:
PJM has experienced significant increases in clearing prices for capacity since the 2024 to 2025 delivery year.
There was no year with more than 10 cumulative hours of dispatch from 2019-2025, with the single exception of Winter Storm Elliott. Last year we saw 30 hours of dispatching for emergency resources on the grid. And as of July 18th 2026, there have already been over 20 dispatch hours
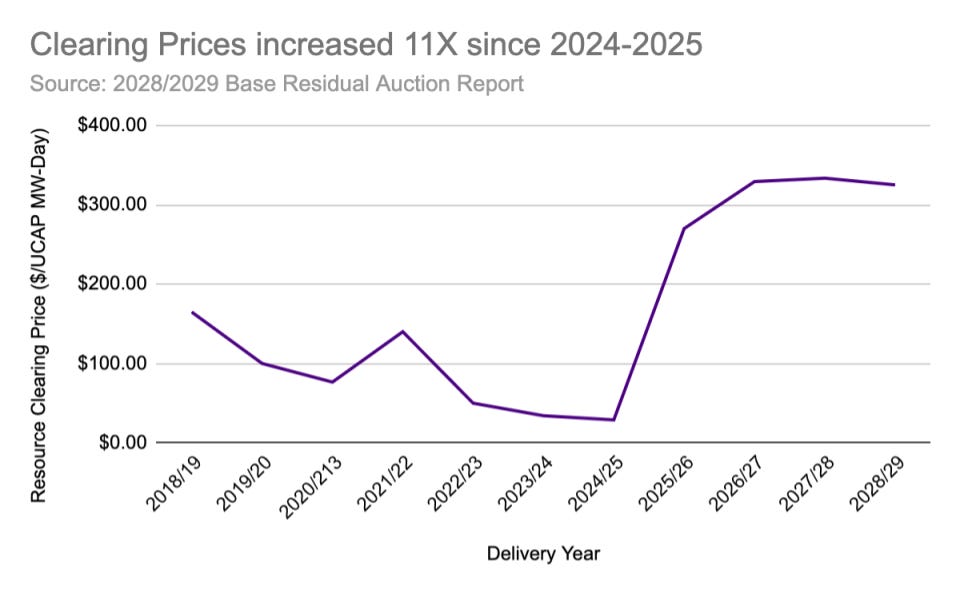
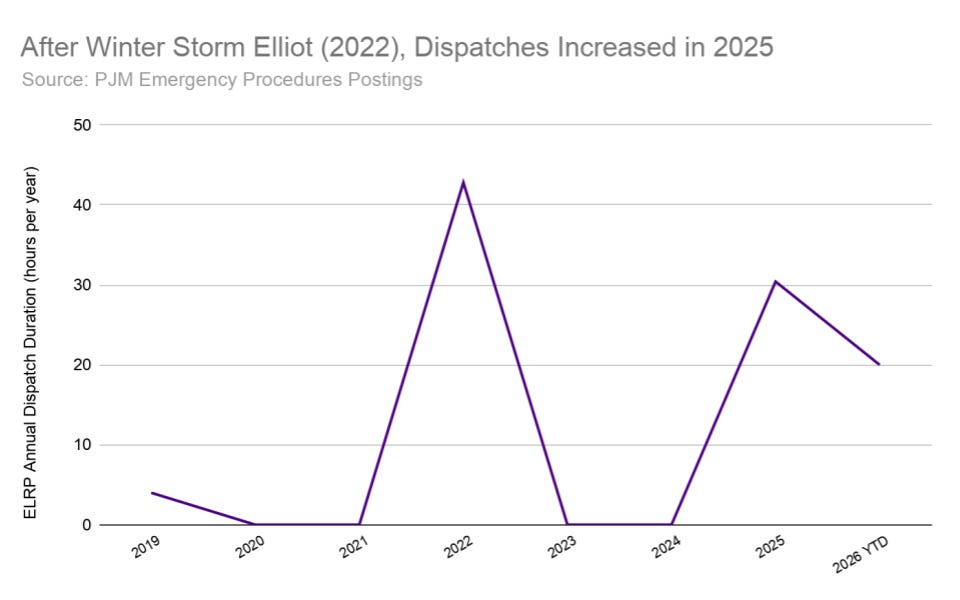
So we have higher value for VPPs participating in PJM’s capacity market, and those resources are being used more. But if you look at the nameplate capacity being offered into the market since the 2018/19 supply year, it has gone down. From the 2024-2025 to 2025-2026 season we saw one of the largest ICAP drops of 1.3 GW of DR nameplate capacity. This was the same season prices cleared at the price cap. Since 2025, third-party aggregators have either decreased or maintained the nominated capacity of VPPs in the market (ICAP). When adjusted for Effective Load Carrying Capacity (ELCC) - how much of a resource’s nameplate capacity will be available during the hours the grid is most likely to fall short - the portfolio has fluctuated as PJM has allowed VPP participation to count in more hours of the year. While there was an increase in the UCAP value of demand response in 2027-2028, this was entirely driven by the change in ELCC calculation (69% up to 92%). This means that the same ~8 GW of VPP capacity had a 33% increase in value per capacity because of the change in ELCC.
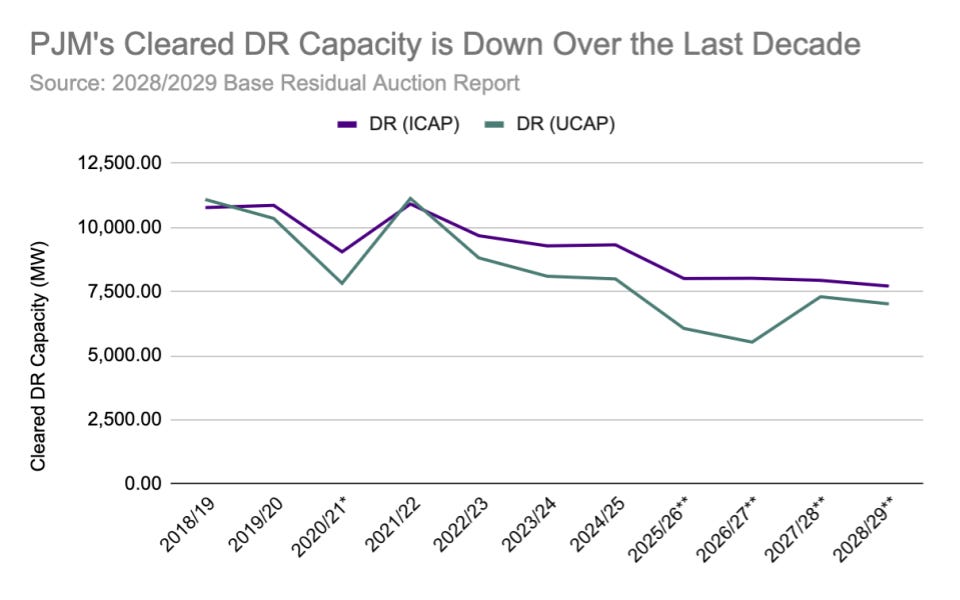
My question is why hasn’t third party VPP capacity increased in PJM? Shayle Kann asked Steve Piper at S&P Global Energy the same question in an interview for Catalyst in July of 2025. He made the point that there would be a “period of adaptation” with the changes to capacity accreditation to include winter months. With a year of additional data, I see some additional reasons that are specific to residential and commercial customers.
Barriers to residential VPP participation
There is a barrier across residential participation just with third-party aggregator access to utility interval data and enrollment data in PJM’s wholesale market. Utilities across PJM have made access to residential interval data extremely challenging. This barrier resulted in Voltus attempting to enroll 20,000 residential Resideo thermostat customers in ComEd and only 4% being able to participate. By comparison, just requiring an account number for enrollment results in only up to 16% of customers completing enrollment according to Brattle Group and Uplight. This means that in ComEd, there was a 4X decrease even compared with requiring details like account number.
Some ISOs like CAISO allow sampling techniques where average performance across a subset of the customers is used for measurement and verification. PJM, however, has also prevented statistical sampling for DR performance results for homes that already have smart meters installed. Both the barriers to statistical sampling and smart meter data severely block growth from a significant new source of wholesale market flexibility.
There are also barriers for EVs and batteries that make smart thermostats the dominant asset for future growth:
EVs are blocked by baselines: PJM’s baseline looks at peak load contribution across the prior year’s peak hours and penalizes increased load during peak hours from one year to the next. This makes EV participation challenging because the first year of EV ownership can result in higher peak load during the peak hour.
Residential storage effectively cannot be compensated for export: This caps nominations and energy revenue at the net load of the household. While there is an Energy Storage Resource enrollment pathway that in theory could result in residential batteries being compensated for exports, this is effectively blocked. My read is that requirements like the day ahead state of charge of the battery, round trip efficiency and ramp rate are not practical for residential storage (Section 2.3.4B).
Residential storage deployment is limited in PJM: In Wood Mackenzie’s US Energy Storage Monitor Q1 2026 and 2025 Year In Review, the team found that Illinois is the only state in PJM that is in the top 5 states for residential battery storage deployment. While this will continue to change, there has not been near the available battery resource in PJM that is now dispatchable in California, Texas or Puerto Rico.
Barriers for commercial participation
By contrast, there has been robust commercial and industrial participation in PJM’s capacity market for over 15 years. And yet, third-party demand response providers on net are decreasing the size of their portfolios’ capacity.
One barrier is increased performance risk for third-party DR providers. In the summer of 2025, average performance for demand response was 67% of UCAP. The target is 100%. Tests are in some ways more forgiving than grid emergencies:
Emergencies can be longer than historic test events that run 2 hours.
When there are no events in PJM, aggregators are evaluated exclusively on test results and they have options to retest if they underperform.
Low performance in PJM can result in penalties that erase all capacity revenue up to 1.5X the committed capacity value (Section 8.4A). With 2025 levels of performance and an expectation of more events than was common historically, third-party demand response providers have more exposure to penalties. Voltus and Enel highlight that they don’t pass on penalty payments directly to end customers outside of offsetting other revenues. With revenue shares as low as 9%, for example between Voltus and the Commonwealth of Virginia, third-party aggregators have a strong incentive to manage penalty risk by right sizing nominations for underperforming customers.
Another barrier is that with PJM’s upcoming Reliability Backstop Procurement (RBP), third-party aggregators have an incentive to leave some assets on the side lines for the 2028-2029 because they could get 70% more value (average $555/MW-day compared to the price cap of $325/MW-day for 2028-2029 participation season) for the asset if it can be demonstrated to be net new capacity for 2029-2030 participation season. For commercial battery projects in particular that have any risk of delays of the June 1st participation window, aggregators may be better off being conservative on the project timeline so that they can lock in 15-year stable contracts at a higher price ceiling. The contract duration could be critical for batteries seeking stable, long term contracts for financing. Notably this addresses the short term concern I had for Voltus and Google’s BYOC contract that had a 3-year duration.
What does this mean for the 2029-2030 participation year?
I see the risks I identified largely being addressed for incremental commercial participation. The right sizing on nominations should largely be addressed over the last two years. And the RBP will result in a bump in incremental capacity. In May I was skeptical of Voltus’s CEO’s assessment that RBP could result in 10 GW of VPP procurement. I forecast 2.5-5 GW largely driven by commercial and industrial demand response assets and new commercial storage development. With the new information since May including more details on the timeline and mechanisms for procurement, I haven’t seen a cause for a significant shift.
I had previously written about development cycles easily being 18 months for commercial batteries. This means that batteries being evaluated now could come online by Q1 2028, far ahead of the April or May of 2029 deadline. I see this auction potentially being highly valuable for commercial batteries that could come online with long-term stable prices at the price cap for the RBP.
One lever that I’m following closely especially in states like New Jersey and Illinois is simplified enrollment pathways to enable residential customer participation. As an example for a single aggregator in one utility in PJM: if 75% of Voltus’s 20,000 interested customers in ComEd with an average nomination of .7 kw per home in the summer could participate, it would result in 10 MW for next year. There are 3 aggregators (Renew Home, Leap and Voltus) and 19 utilities in PJM where similar sized customer populations could try to enroll. This could unlock up to an additional 500 MW beyond my current forecast.
If this growth does take off in 2029-2030, the contrast between utility-led VPPs and wholesale markets is not that one is antifragile and one is not. Rather wholesale market participation is resulting in slower feedback loops than utility programs. If this is true across wholesale markets, utility-led VPPs could grow faster than VPPs in wholesale markets.
What Did I Miss — or Get Wrong?
Spot a story that should have been in this week’s issue? Disagree with the way I’m interpreting the facts? Just comment in notes with a link to the story or your take.
Opinions are my own and not the views of my employer. Research and drafting for this issue was produced with the assistance of Claude AI. Special thanks to Michael Schweitzer for feedback on PJM’s market dynamics. All editorial decisions are mine.